


K2 supports custom Service Brokers that allows K2 Developers to connect any data source with a K2 SmartObjects. During the development process, debugging is useful to troubleshoot your service broker’s code. In the blog post we show how you can debug a custom K2 service Broker by adding a break point in Visual Studio and attaching to the K2 HostServer process.
K2 Automated Testing Software
BenchQA allows full test automation of K2, including fully automated K2 SmartForms and K2 Workflow testing. It promotes test driven development for K2 and ensures continued quality assurance for K2 solutions. Easily apply changes to test cases to accommodate changes to K2 apps and ensure all apps are regression tested to avoid defects and assure continuous quality.

Step 1:
Deploy the dll’s for the service broker and make sure the dll’s version must be same in K2 Service broker folder (C:Program Files (x86)K2 blackpearlServiceBroker) or else debug breakpoint won’t hit while debugging. Register service type and create a Service Instance and a Smartobject out of Custom service broker.
Step 2:
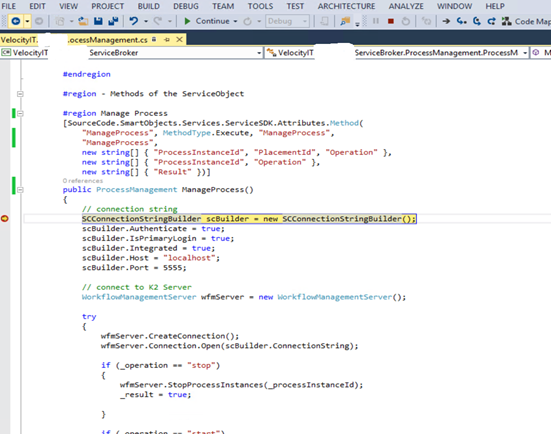
Provide a proper debug breakpoint on the service broker code.
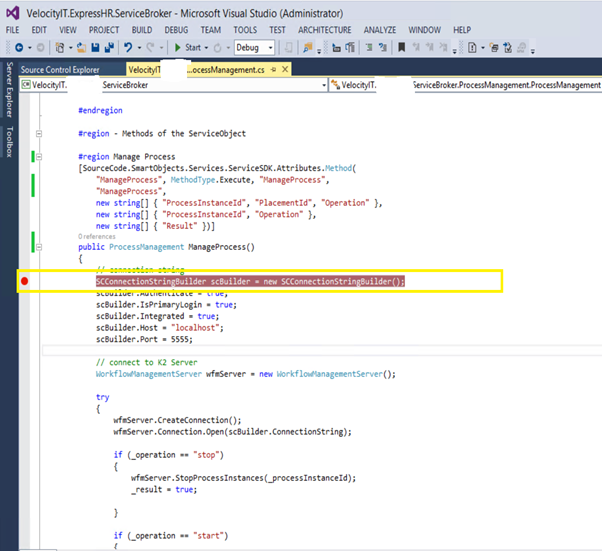
1 – K2 Service Broker Code
Step 3:
Go to Tools on task bar of VS and Click on attach to process
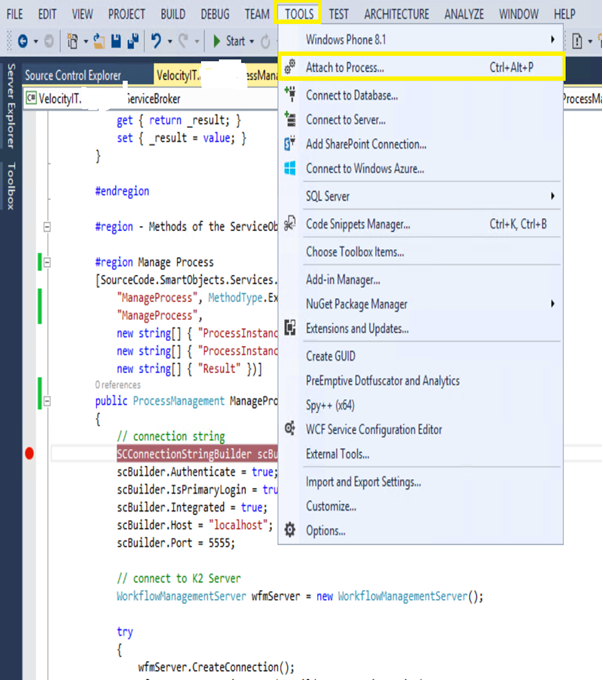
2 – Attach to K2 Host Server
Step 4:
An Attach to process box pops up. Check “Show processes from all users” checkbox and select
K2HostServer.exe process and click on attach.
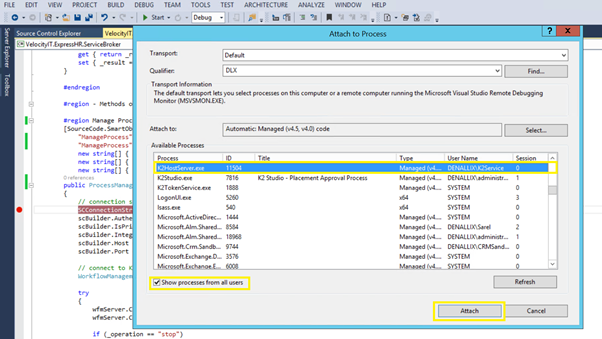
3 – Attach to K2 Host Server
Step 5:
Click on attach for the Attach Security Warning

4 – Attach to K2 Host Server
Step 6:
Execute your Smartobject method which you created from your deployed service broker
with proper inputs.
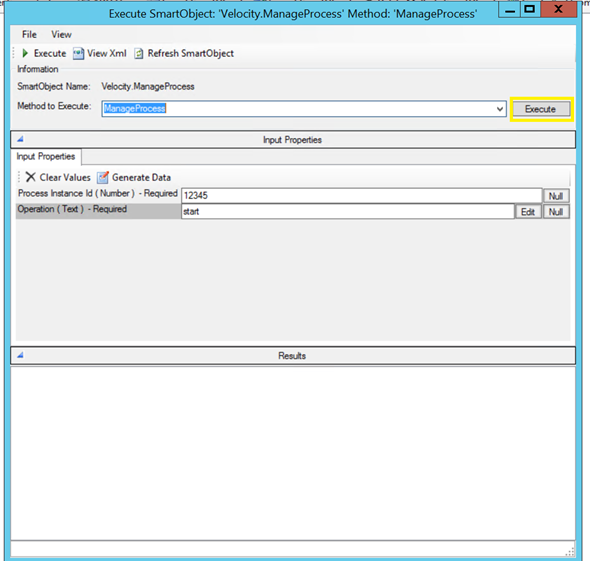
5 – Hit the K2 Service Broker Runtime
Step 7:
As a result, you can see the breakpoint hits and you can continue with debugging.
6 – Hit the breakpoint